41 Results
View results:
Sort by:
The Views Navigator in RFEM 5 and RSTAB 8 provides many options for setting the screen views.
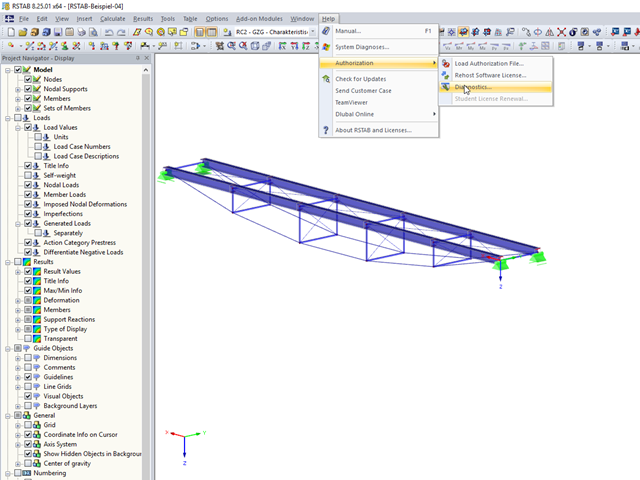
In RFEM 5 and RSTAB 8, you can view detailed information on the currently used license and installed dongle driver. In case of any problems with the license, you can send the created text file to the Dlubal Software hotline, which allows us to provide you with a fast and efficient analysis. To create the file, select "Help" → "Authorization" → "Diagnostics".
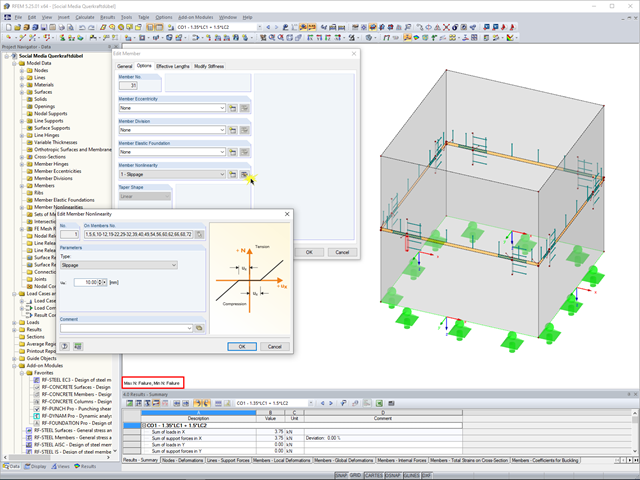
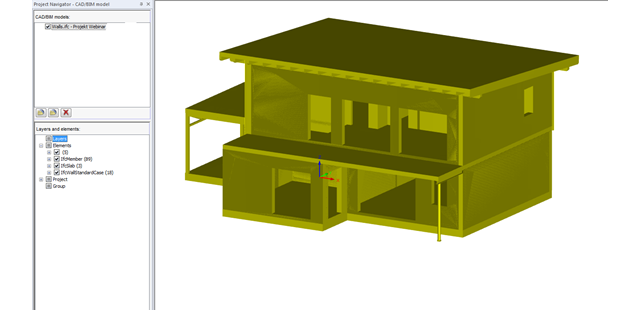
RFEM 5 allows you to use many different member nonlinearities for designing a model. In the following text, we look at an example of the use of the "slippage" member nonlinearity. The example is a simplified model of a concrete manhole with a square plan view.
The description of load cases, load combinations, or result combinations is often longer than fits into the drop‑down combo box "Current Load Case, Load Combination, Result Combination or Module Case" in the toolbar of RFEM or RSTAB.
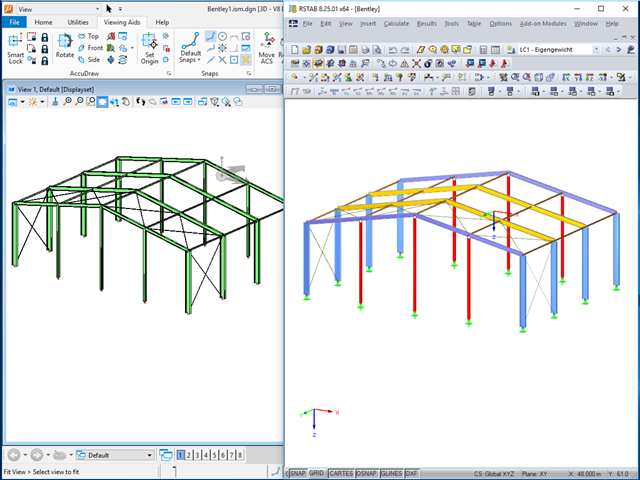
The ISM file (ISM = Integrated Structural Modeling) in RFEM and RSTAB provides an interesting option for exchanging data. If you export a model to this data format, you can view and analyze it with the free ISM viewer from Bentley.
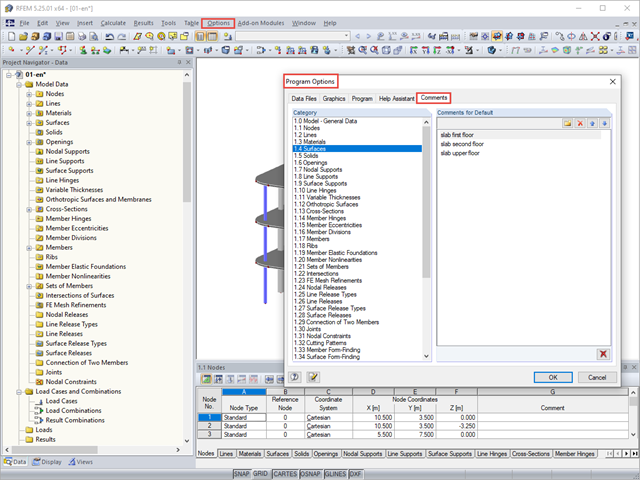
You can assign comments to each element in RFEM and RSTAB (structure element, load element, and so on). This can help to improve the overview and documentation of structures, as the comments appear in the printout report and, for example, certain objects can be filtered and displayed using the "Select Special" function.
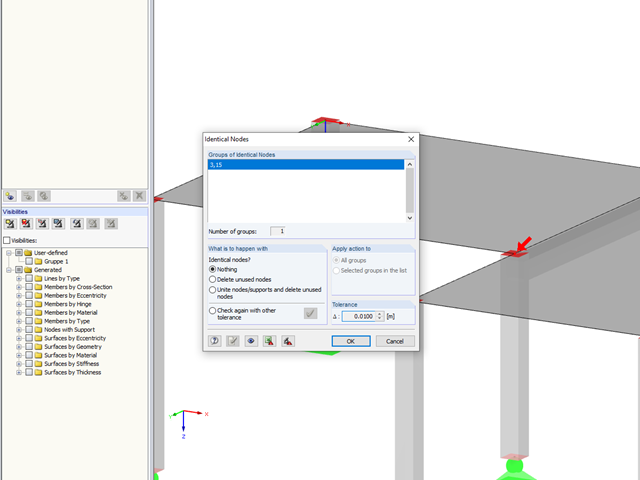
In RFEM 5 and RSTAB 8, you can save problems and warnings occurring during the model check as an extra view. This way, you can easily work through the hints and messages, one after the other, cleaning the model. The function is available for double nodes, overlapping members/lines, and surfaces.
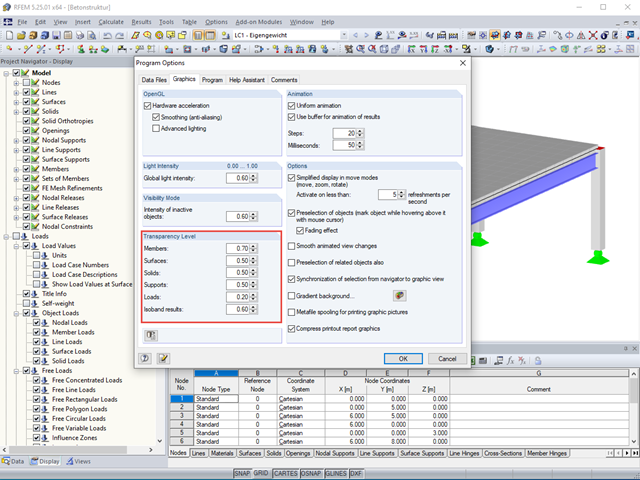
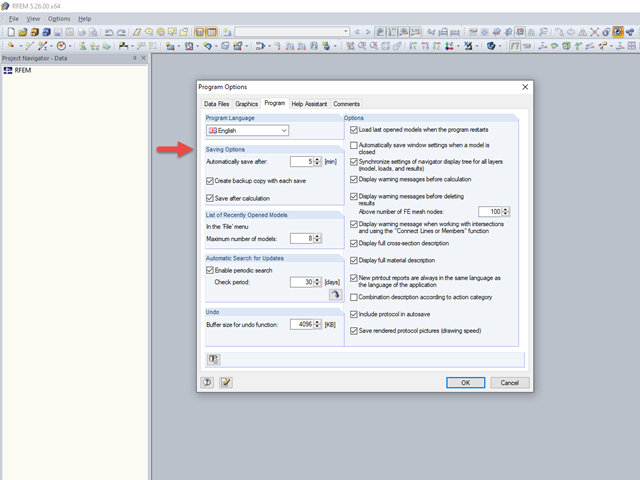
The transparency intensity of various graphic elements in the Solid Transparent Display Mode can be edited individually in the Program Options dialog box under the Graphic tab to improve the overview.
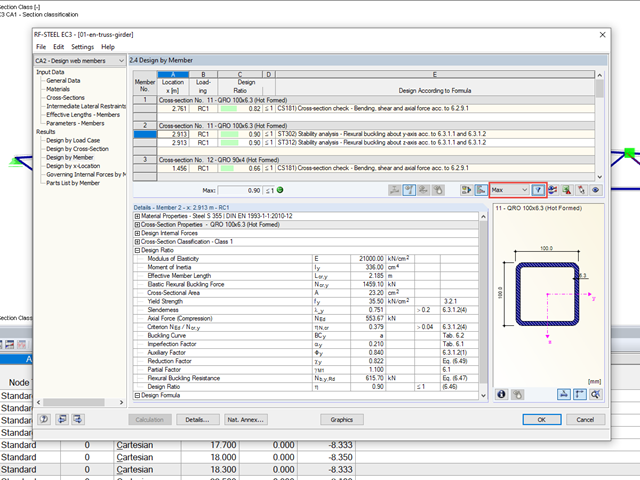
When designing several members in one design case, it is sometimes difficult to recognize the governing design checks. To improve the overview and to display the relevant design checks in a compact way, you can use the filter options under the result tables. These are included in all design modules of steel, aluminum, and timber structures in RFEM and RSTAB.
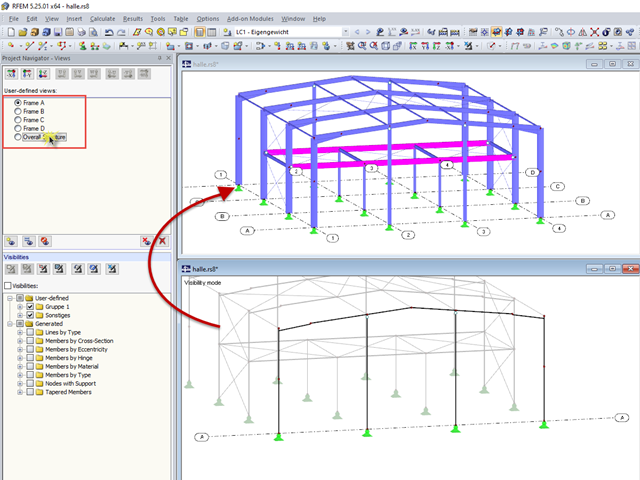
RFEM and RSTAB offer many display options in the Display Navigator. They can be completely different, depending on their function. You often have to click several times to make certain changes. If you want to optimize your work, you can create user‑defined views. In these views, you can save all specified settings. The following example illustrates this principle.
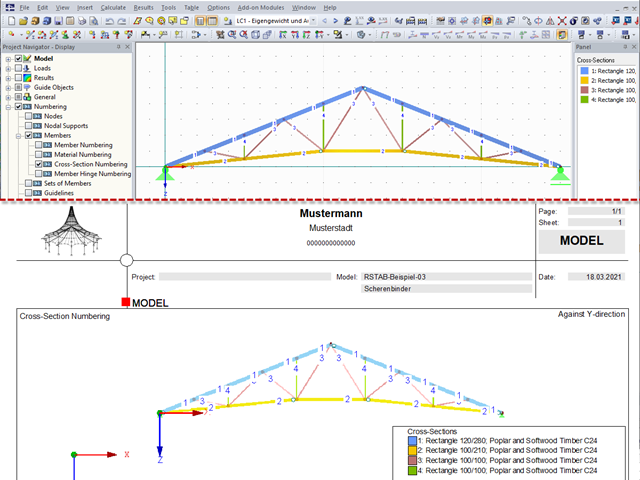
For a quick overview of the cross‑sections used, you can show the members in color sorted by cross‑section. Use the right mouse button in the work window to select "Colors in Graphics According to" → "Cross -Sections" from the shortcut menu. In the current program versions, you can use a panel with an editable color scale for this.
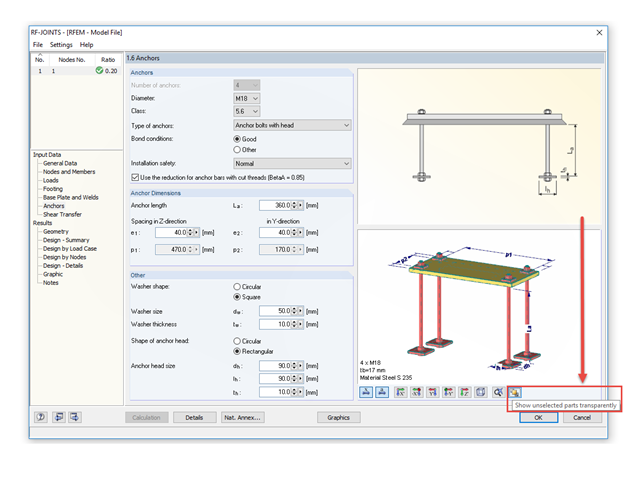
The RF‑/JOINTS add‑on modules are equipped with a graphical window that shows all the structural components of the connection. There, you can use the mouse functions known from RFEM and RSTAB to zoom, move, or rotate the view.
RFEM and RSTAB save the input data, the FE mesh, the results, the printout reports, and the 3D gITF model preview, including all visual objects, in one file.
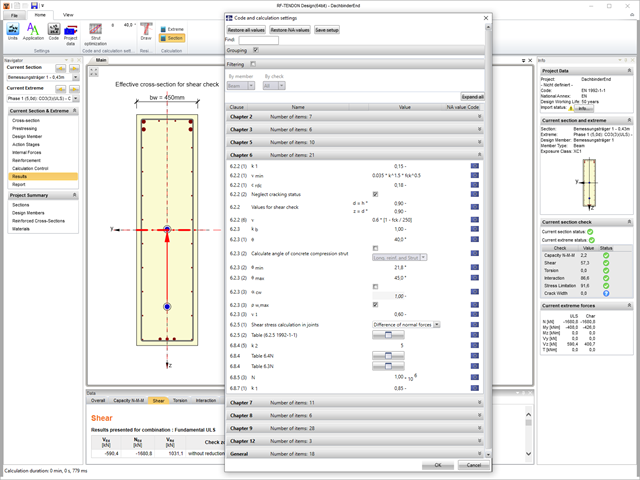
In RF‑TENDON and RF‑TENDON Design, you can review and adjust the code‑dependent factors, calculation parameters, and calculation methods using the "Code" button. You can display the settings and adjustment options according to a chapter of a code, selecting the "Grouping" option in the dialog box.
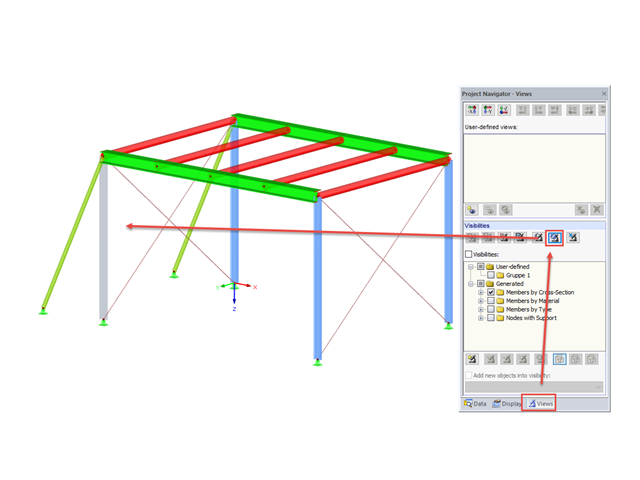
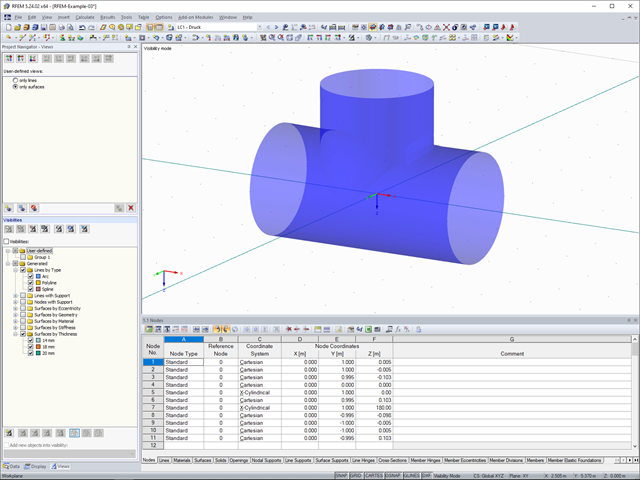
In RFEM and RSTAB, you can apply various visibilities in the Views project navigator.
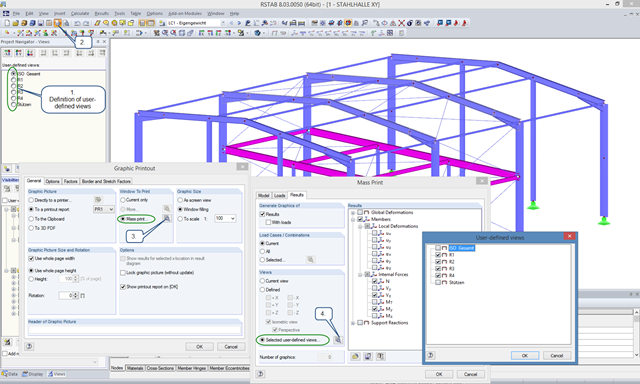
User-defined views are a very useful tool for effective modeling, as the previously selected and adapted objects appear directly with a click of the mouse. These objects can also be used easily to create informative and clearly arranged result graphics. With just a few clicks, you can create all result graphics at once using the mass print function.
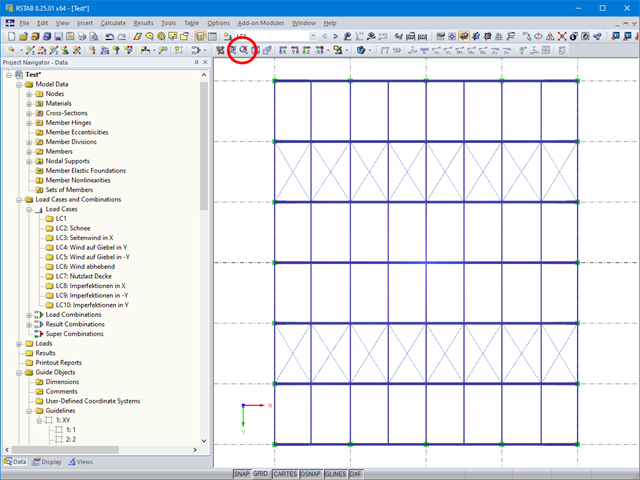
If you want to consider guide objects in the overall view (F8 key or double-click on the mouse wheel) or, for example, in a particular direction of the views, you can enable this option in the settings of the particular guide objects (guidelines, background layers, line grids).
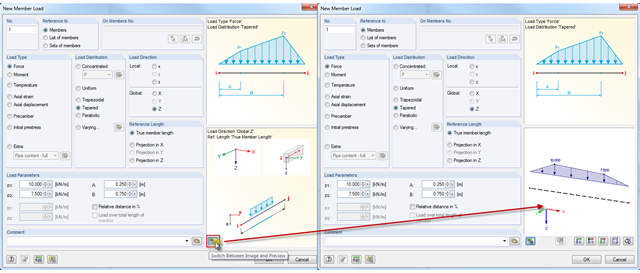
RFEM and RSTAB provide a helpful preview to check the input of member and line loads in the dialog box.
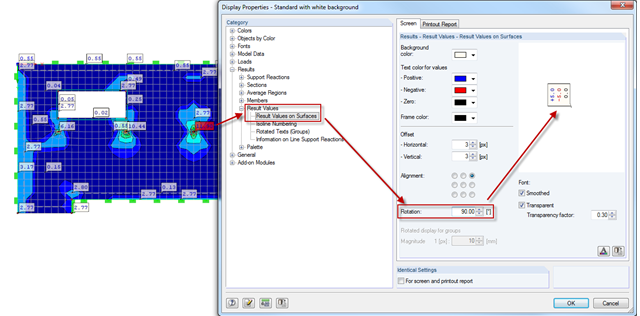
Sometimes, it is necessary to rotate graphics in the printout report. In order to also display the result values correctly, you can rotate the results by the respective angle using the Display Properties dialog box. As usual in Display Properties, this setting is to be done separately for the screen view and the printout report.
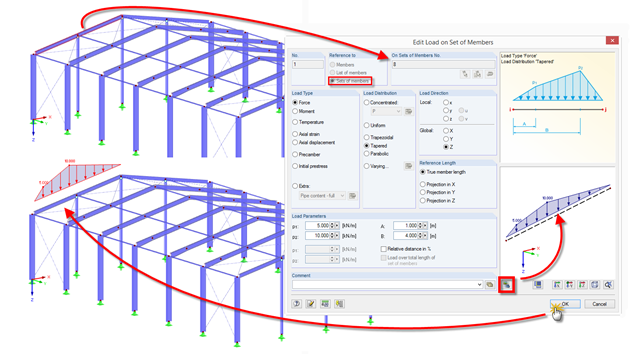
In addition to the load direction and reference length of member loads, it is now possible to display a preview of the loading.
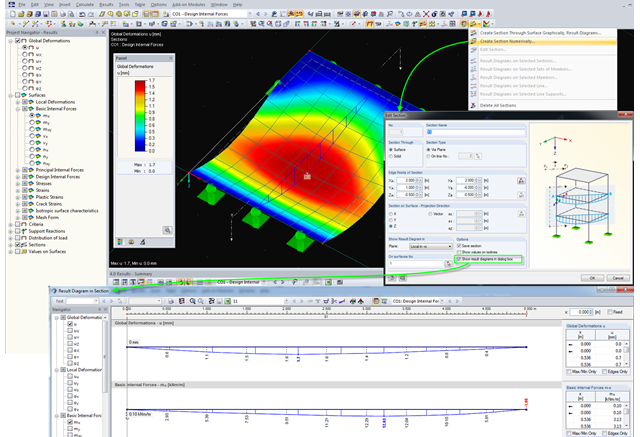
For evaluating results on surfaces, RFEM provides the option to define sections. Basically, two different types of sections are available. One, the creation of a temporary section showing the result diagrams of the desired cutting edge only once; the other, the definition of a section in the dialog box, which is then created as a separate object in RFEM, and thus the results can be viewed at any time. Displaying the results of defined sections is done graphically in RFEM, but they can also be displayed separately in a dialog box and be included in the printout report.
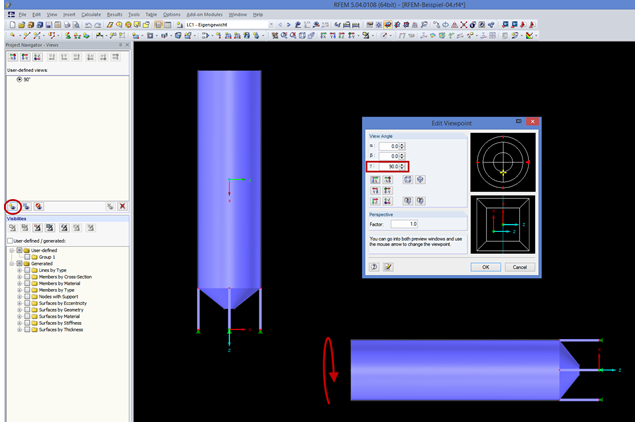
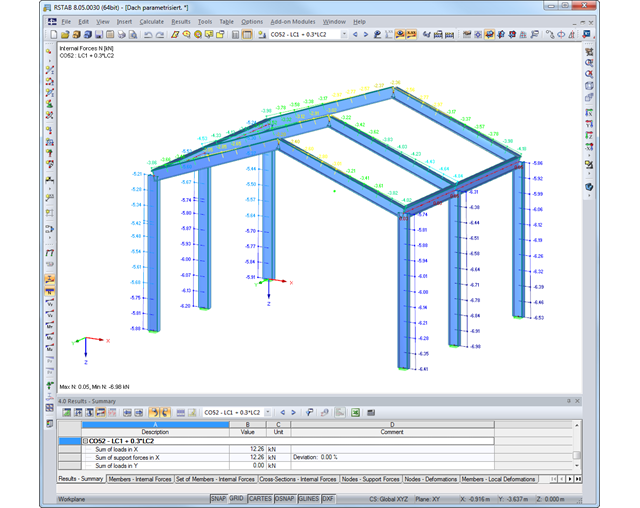
If you consider rotating the structure shown in the figure around the global Y‑axis, this might be not straightforward. In order to achieve better handling, the axis is always locked in the direction of your view. In the case of very high structures, it may be helpful to rotate the view about 90 degrees in the viewing direction.
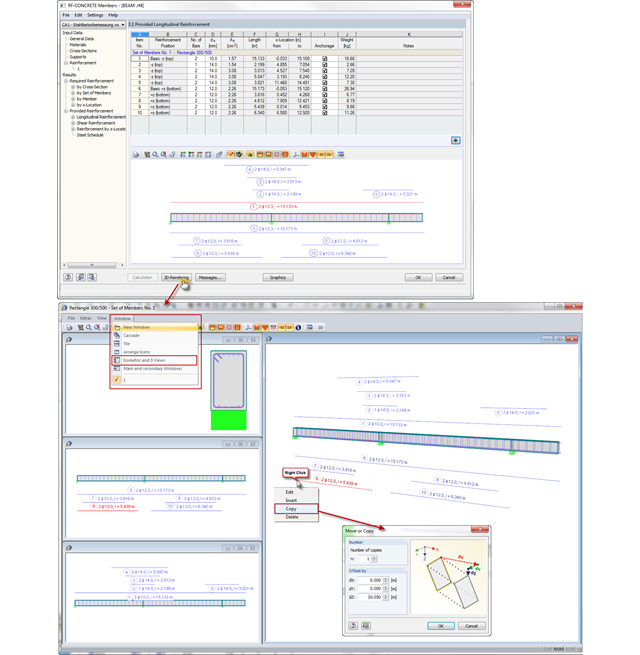
In CONCRETE and RF‑CONCRETE Members, you can open a dialog box with a 3D rendering of the existing reinforcement in Window 3.1 or 3.2. Now, you can also display different reinforcement views in several dialog boxes at the same time. The "Isometric and 3 Views" option known from RFEM is available here as well.
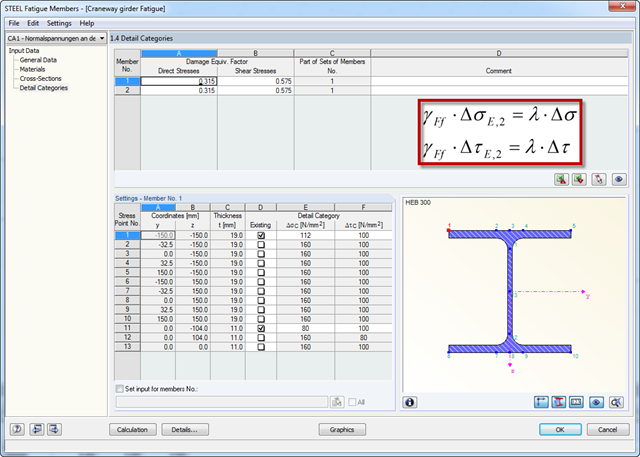
Damage equivalent factors depend on the respective components to be designed in RF‑/STEEL Fatigue Members, and they are explained in the corresponding standards. The following list shows an overview of the standards describing the calculation of the damage equivalent factors in detail.
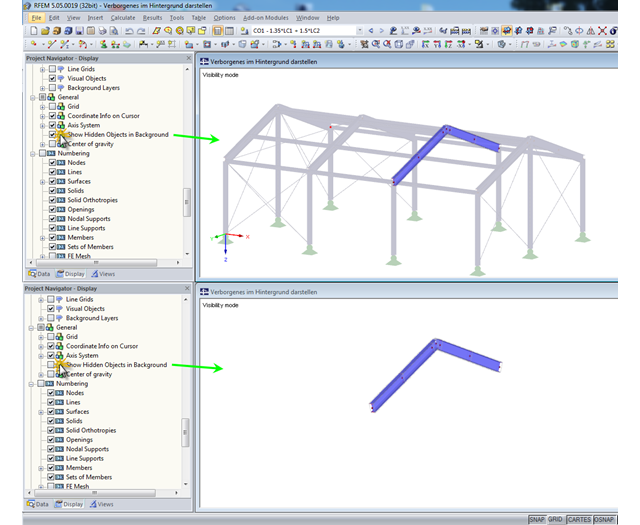
In RFEM and RSTAB, you can specify user-defined views and visibilities. The remaining or hidden structure is displayed in the background by default. This may be useful when processing complex structures, but it can also be disruptive when displaying the structure in detail.
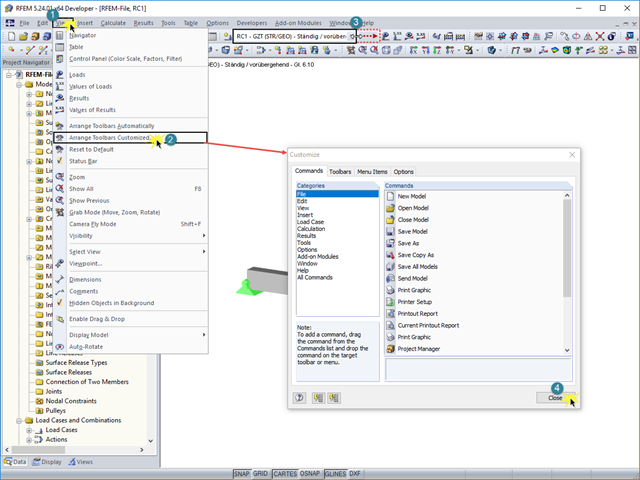
You can change the content and appearance of a toolbar under "View" → "Arrange Toolbars Customized". This way, you can easily arrange and save frequently used commands in specific user‑defined toolbars. In addition to the default arrangement on the top of the screen, you can dock the toolbars on the left and right edges of the screen for a better overview.
As in RFEM, load combinations can be generated automatically in RF‑PIPING. This feature is activated by default and creates the recommended load and result combinations for piping design. It is necessary to assign the relevant action category to load cases in order to generate the correct combinations. To do this, new action categories have been implemented specifically for loads on piping.
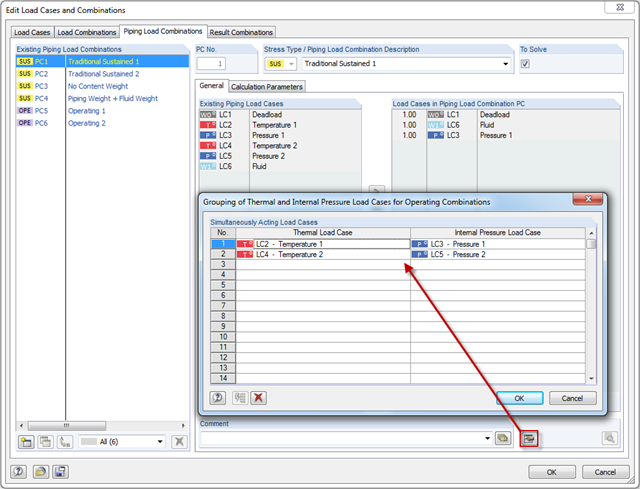
Pressure temperature conditions are generated as the sets of the first (second, third, and so on) load case of the "Pressure" category and the first (second, third, and so on) load case of the "Temperature" category. The default setting can be reviewed or adjusted in the "Grouping of Thermal and Internal Pressure Load Cases for Operating Combinations" dialog box. You can access this dialog box by clicking the corresponding button in the "Piping Load Combinations" tab of the "Load Cases and Combinations" dialog box. This dialog box is automatically offered to check your entries in the case of any change of the load case from the "Pressure" or "Temperature" category.
Pressure temperature conditions are generated as the sets of the first (second, third, and so on) load case of the "Pressure" category and the first (second, third, and so on) load case of the "Temperature" category. The default setting can be reviewed or adjusted in the "Grouping of Thermal and Internal Pressure Load Cases for Operating Combinations" dialog box. You can access this dialog box by clicking the corresponding button in the "Piping Load Combinations" tab of the "Load Cases and Combinations" dialog box. This dialog box is automatically offered to check your entries in the case of any change of the load case from the "Pressure" or "Temperature" category.
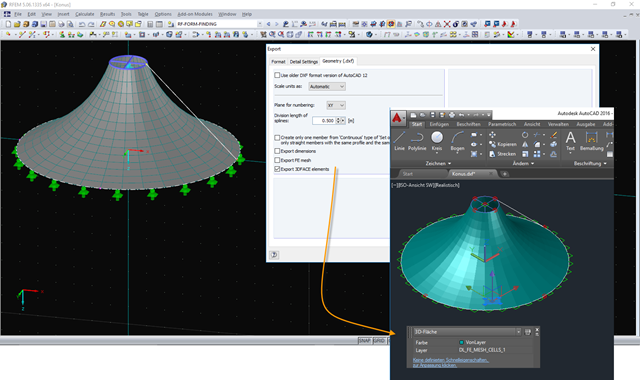
The DXF interface in RFEM now exports a 3DFACE element in the DXF file for each FE mesh cell of the exported structure. The 3DFACE element is detected by AutoCAD during import, for example, and can be displayed as a surface in the graphic. Different visual styles help display the 3DFACE surfaces in a desired view.
The "Coordination View 2.0" Import allows you to import virtually any physical models from various programs into RFEM/RSTAB to generate an analytical model.
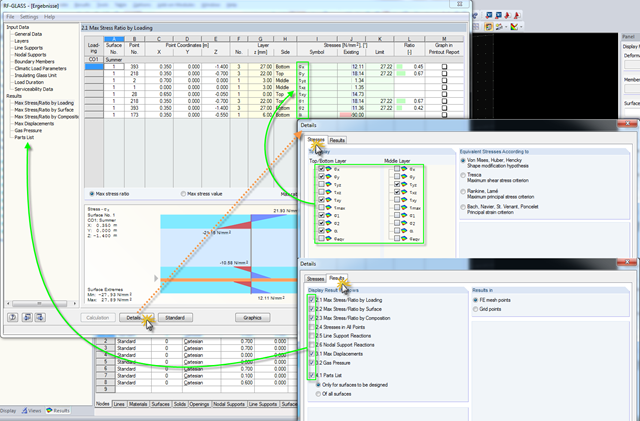
Click the [Details] button in RF-GLASS to select the results to be displayed. In order to get a better overview for the result evaluation, you can select the individual stress graphics (principal stresses, stresses oriented to axes, shear stresses) as well as various result windows. This way, you can show only the results you require.